

Introduction
The rivalry between India and South Africa is one of the most exciting contests in international cricket. Both teams have developed strong batting line-ups, experienced bowling attacks and talented all-rounders who can change the direction of a match. Their encounters across Test cricket, One Day Internationals and T20 Internationals regularly attract attention from cricket supporters around the world.
The india national cricket team vs south africa national cricket team match scorecard provides a detailed picture of how these two sides perform against each other. It records individual batting contributions, bowling figures, partnerships, extras, wickets and the final result. These details help readers understand not only which team won but also how the match developed throughout the innings.
Latest India vs South Africa Match Overview
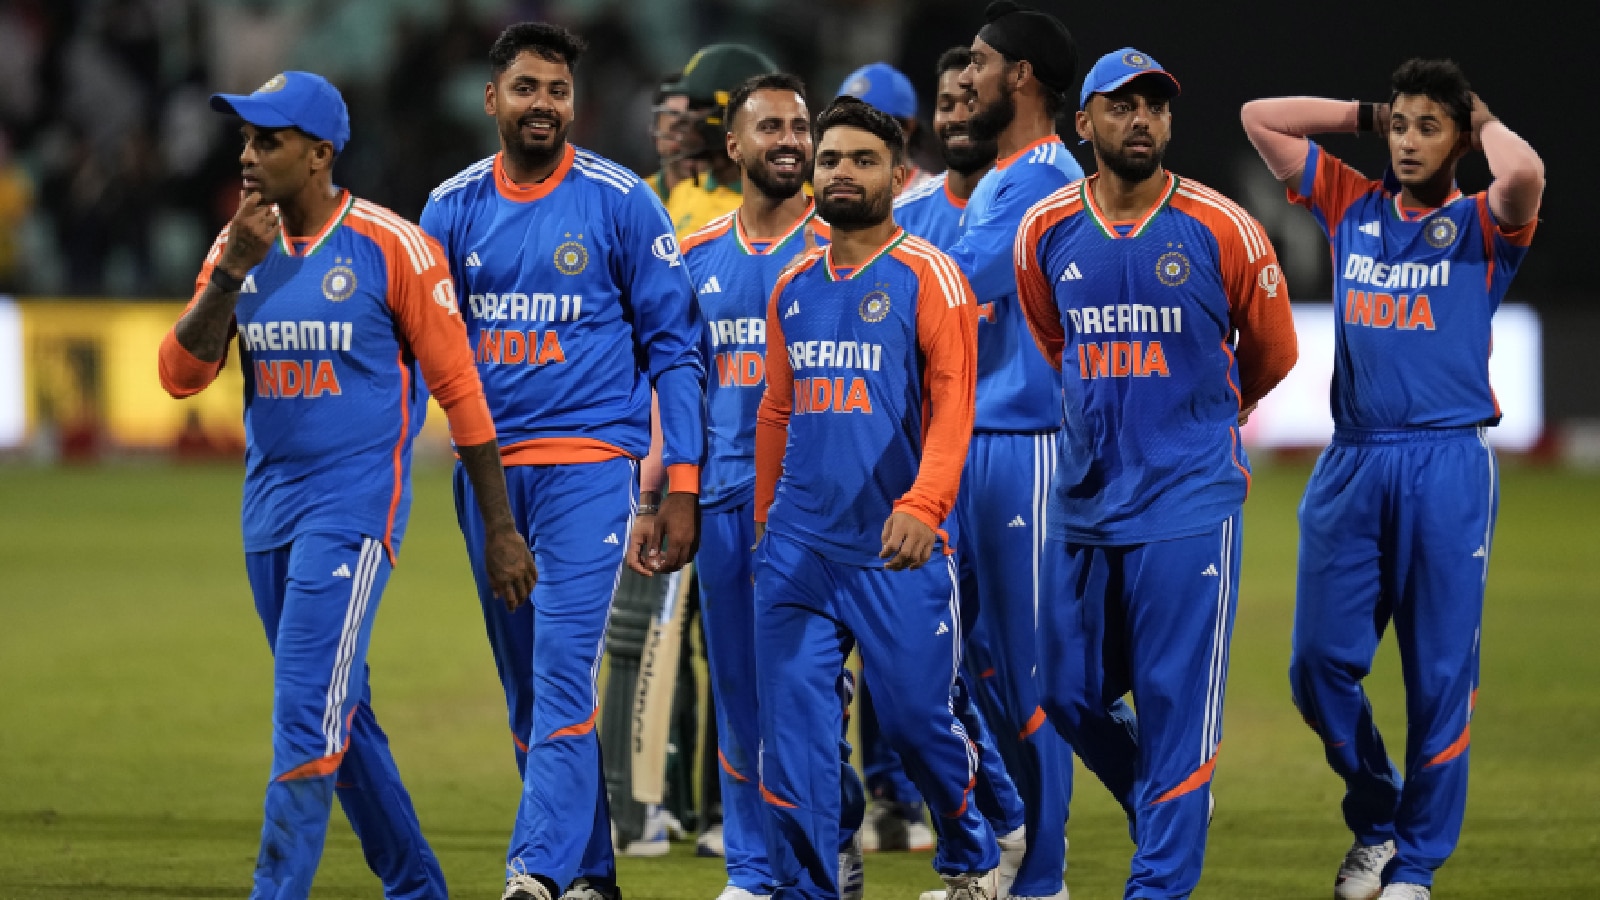
One of the major recent meetings between these teams took place on 22 February 2026 during the ICC Men’s T20 World Cup at Narendra Modi Stadium in Ahmedabad. South Africa won the contest by 76 runs after producing an impressive batting performance and then restricting India’s chase.
South Africa scored 187 runs for seven wickets in 20 overs. India, in response, were dismissed for 111 runs in 18.5 overs. David Miller played an important role with the bat, while Marco Jansen delivered an outstanding bowling performance. The result demonstrated South Africa’s ability to perform under pressure in a major international tournament.
Match Details and Scorecard Summary
| Match information | Details |
|---|---|
| Teams | India vs South Africa |
| Tournament | ICC Men’s T20 World Cup 2026 |
| Date | 22 February 2026 |
| Venue | Narendra Modi Stadium, Ahmedabad |
| Format | T20 International |
| Toss | South Africa elected to bat |
| South Africa | 187/7 (20 overs) |
| India | 111 all out (18.5 overs) |
| Result | South Africa won by 76 runs |
The match details show that South Africa established control during the first innings and maintained that advantage with disciplined bowling. India’s batting order struggled to build partnerships, making the chase increasingly difficult.
South Africa Batting Performance
South Africa’s batting performance was built around a combination of experienced players and aggressive young batters. David Miller was the leading scorer, making 63 runs from 35 deliveries. His innings included seven boundaries and three sixes, giving the team valuable momentum during the middle and later stages of the innings.
Dewald Brevis contributed 45 runs from 29 balls, showing his ability to attack the Indian bowling attack. Tristan Stubbs remained unbeaten on 44 from 24 deliveries, helping South Africa finish with a competitive total. These contributions were particularly important because they allowed the team to recover from early setbacks and accelerate towards the end of the innings.
South Africa Batting Scorecard
| Batter | Runs | Balls |
|---|---|---|
| David Miller | 63 | 35 |
| Dewald Brevis | 45 | 29 |
| Tristan Stubbs | 44* | 24 |
| Aiden Markram | 4 | 7 |
| Quinton de Kock | 6 | 7 |
| Ryan Rickelton | 7 | 7 |
| Team total | 187/7 | 20 overs |
*Selected leading batting contributions; not a complete individual scorecard.
India’s Bowling Performance
India’s bowlers had the responsibility of controlling South Africa’s scoring rate and preventing the opposition from reaching a very large total. Jasprit Bumrah was among the most effective performers, taking three wickets for 15 runs in four overs. His accuracy and ability to create pressure provided India with important breakthroughs.
Arshdeep Singh also contributed with two wickets for 28 runs. Shivam Dube picked up one wicket, but South Africa’s middle-order batters continued scoring at a healthy pace. Although India’s bowling attack produced some successful moments, the opposition’s partnerships made it difficult to restrict the final total.
India Batting Performance
India began the chase with the intention of scoring quickly, but South Africa’s bowlers made early breakthroughs that changed the situation. The loss of important top-order wickets placed pressure on the middle order, leaving the remaining batters with a challenging task.
Shivam Dube was India’s leading scorer with 42 runs from 37 deliveries. He attempted to stabilise the innings and keep the chase alive through a mixture of controlled batting and attacking shots. Hardik Pandya added 18 runs, while Suryakumar Yadav scored 18. However, the team could not establish the partnerships required to reach the target.
The india national cricket team vs south africa national cricket team match scorecard highlights the difference between the two sides’ batting performances. South Africa had several substantial contributions, whereas India depended heavily on a smaller number of batters.
India Batting Scorecard
| Batter | Runs | Balls |
|---|---|---|
| Shivam Dube | 42 | 37 |
| Suryakumar Yadav | 18 | 22 |
| Hardik Pandya | 18 | 17 |
| Abhishek Sharma | 15 | 12 |
| Washington Sundar | 11 | 11 |
| Tilak Varma | 1 | 2 |
| Ishan Kishan | 0 | 4 |
| Jasprit Bumrah | 0 | 1 |
| Team total | 111 | 18.5 overs |
Selected batting figures; the table is not a complete list of all dismissals.
South Africa Bowling Performance
South Africa’s bowling attack was one of the biggest reasons behind the victory. Marco Jansen delivered an excellent spell, claiming four wickets for 22 runs in 3.5 overs. His ability to take wickets at important moments prevented India from developing a stable partnership.
Corbin Bosch also made a valuable contribution by taking two wickets. Keshav Maharaj and Aiden Markram provided additional support, ensuring that India’s batters could not settle comfortably at the crease. South Africa’s bowlers combined disciplined line and length with effective variations to defend the target successfully.
Key Players of the Match
Several players influenced the outcome through their individual performances. Their contributions explain why South Africa managed to secure a convincing victory.
David Miller: Miller played an important role in South Africa’s innings by scoring 63 runs. His aggressive approach helped the team increase its scoring rate and establish a strong total.
Dewald Brevis: Brevis contributed 45 runs and provided valuable support to Miller. His attacking batting helped South Africa maintain momentum during the middle overs.
Tristan Stubbs: Stubbs remained unbeaten on 44 runs. His finishing ability helped South Africa reach 187 runs in the allotted 20 overs.
Marco Jansen: Jansen was outstanding with the ball, taking four wickets and putting India’s batting order under considerable pressure.
Jasprit Bumrah: Bumrah was India’s most successful bowler, finishing with three wickets for 15 runs. His economical spell was one of the positive aspects of India’s performance.
Important Turning Points of the Match
The first major turning point was South Africa’s ability to recover and accelerate after losing early wickets. Instead of allowing India to dominate, the middle-order batters built useful partnerships and increased the scoring rate.
Another important moment came when David Miller and Dewald Brevis attacked the Indian bowlers. Their contributions helped South Africa create a strong platform for the final overs. Tristan Stubbs then continued the scoring momentum with an unbeaten innings.
India’s chase became difficult after losing wickets during the powerplay. The middle order needed a substantial partnership to rebuild the innings, but South Africa’s bowlers continued taking wickets. Marco Jansen’s spell further reduced India’s chances of completing the chase. These moments ultimately shaped the 76-run result.
Head-to-Head Rivalry Between India and South Africa
India and South Africa have shared a competitive international cricket rivalry across all three major formats. India generally benefits from its strong batting depth and familiarity with subcontinental conditions, while South Africa is known for its pace bowling, athletic fielding and powerful middle order.
Their encounters have featured close finishes, impressive individual centuries, match-winning bowling spells and important tournament clashes. In Test cricket, the contest often revolves around patience, technique and the ability to handle fast bowling. ODI matches usually highlight batting depth and partnerships, while T20 contests depend heavily on power-hitting, bowling variations and execution under pressure.
The india national cricket team vs south africa national cricket team match scorecard is useful for comparing these different performances and understanding how the rivalry changes across formats.
Difference Between Test, ODI and T20 Scorecards
A cricket scorecard changes according to the format of the match. Understanding these differences helps readers interpret the statistics correctly.
| Format | Overs | Main scoring characteristics |
|---|---|---|
| Test | Unlimited, up to five days | Four innings and longer batting partnerships |
| ODI | 50 per team | Balance between attacking and defensive cricket |
| T20I | 20 per team | Aggressive batting and quick scoring |
In Test matches, readers should examine individual innings, declarations, follow-ons and bowling workloads. ODI scorecards provide information about run rates, partnerships and performance across 50 overs. T20 scorecards place greater emphasis on strike rates, boundaries, economy rates and wickets taken during crucial overs.
Why Match Scorecards Are Important for Cricket Fans
A scorecard is more than a record of runs and wickets. It provides a statistical explanation of the entire match and allows readers to evaluate individual and team performances. Supporters can identify the leading run-scorers, most successful bowlers and partnerships that influenced the result.
Scorecards are also useful for sports writers, analysts and cricket enthusiasts who compare performances across different tournaments. By studying batting averages, strike rates, bowling economy and wicket-taking records, readers can understand the strengths and weaknesses of both teams.
For example, the Ahmedabad T20 World Cup contest demonstrated how a strong middle-order performance followed by effective wicket-taking can determine the result of a high-pressure match.
Future Expectations From India and South Africa
Both teams have the resources to remain competitive in international cricket. India continues to develop talented batters, quality fast bowlers and versatile all-rounders. Its strength lies in having players capable of adapting to different conditions and match situations.
South Africa also possesses a talented group of cricketers who can perform in challenging international environments. Its pace attack, aggressive batting options and athletic fielding make it a difficult opponent. Future meetings between these sides are likely to attract significant attention because both teams have the potential to produce exciting cricket.
Fans will also be interested in how emerging players perform against experienced international stars. Such contests provide opportunities for young cricketers to establish themselves and become important members of their national teams.
How to Read the India vs South Africa Scorecard
Readers who are new to cricket may find some scorecard abbreviations confusing. However, understanding a few basic terms makes it easier to follow the match.
-
R: Runs scored by an individual batter.
-
B: Number of balls faced.
-
4s: Number of boundaries hit.
-
6s: Number of sixes hit.
-
SR: Batting strike rate.
-
O: Overs bowled by a bowler.
-
W: Number of wickets taken.
-
Econ: Average runs conceded per over.
-
DNB: Did not bat.
-
Not out: A batter who remained at the crease when the innings ended.
These statistics help supporters understand how effectively players performed. For example, a high batting strike rate indicates faster scoring, while a low bowling economy generally indicates better control over the opposition’s scoring.
Frequently Asked Questions
1. Who won the latest India vs South Africa T20 World Cup match discussed here?
South Africa won by 76 runs on 22 February 2026 in Ahmedabad.
2. What was South Africa’s total?
South Africa scored 187 runs for seven wickets in 20 overs.
3. What was India’s total?
India were dismissed for 111 runs in 18.5 overs.
4. Who scored the most runs for South Africa?
David Miller was the leading scorer with 63 runs from 35 balls.
5. Who was the best bowler in the match?
Marco Jansen took four wickets for 22 runs in 3.5 overs.
6. Who was India’s highest run-scorer?
Shivam Dube scored 42 runs from 37 deliveries.
7. Where was the match played?
The match took place at Narendra Modi Stadium in Ahmedabad, India.
Conclusion
The India and South Africa cricket rivalry continues to deliver exciting moments, competitive performances and memorable international contests. Their February 2026 T20 World Cup encounter in Ahmedabad was another example, with South Africa defeating India by 76 runs. David Miller, Dewald Brevis and Tristan Stubbs contributed significantly with the bat, while Marco Jansen led the bowling attack with four wickets.
The india national cricket team vs south africa national cricket team match scorecard provides valuable insights into the performances, important partnerships and turning points that shaped this encounter. By following scorecards and analysing individual statistics, cricket fans can develop a better understanding of both teams and enjoy their future contests with greater knowledge.

